What would improve the case?
Pricing power, product mix, profitable demand and cash conversion.
Does business quality justify the valuation premium?
| Metric | Ferrari | Porsche AG |
|---|---|---|
| P/E | 37.30× | 44.89× |
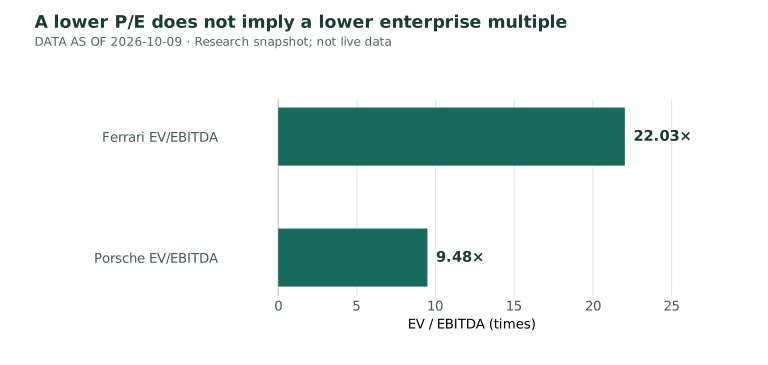
| EV/EBITDA | 22.03× | 9.48× |
| TTM EBITDA / net profit | 1.74× | 5.65× |
Porsche’s TTM net profit is small relative to EBITDA: approximately €843m versus €4,765m, against Ferrari’s €1,636m and €2,847m. Differences below EBITDA, net debt and equity value affect P/E, so a lower EV/EBITDA does not force a lower P/E.
I use Porsche to test an automotive valuation discount. It is not a clean substitute for Ferrari’s luxury positioning. Hermès and LVMH offer useful brand/pricing-power perspectives, but their product mixes and capital requirements differ too. A fair-value case needs matched-date inputs rather than a pooled multiple assembled from unlike periods.
Pricing power, product mix, profitable demand and cash conversion.
Luxury demand, multiple compression, execution and the comparability of Porsche’s financing and control structure.
My research, Python analysis and original notebook charts. The downloadable Excel comps workbook extends the notebook’s calculations.
Market cutoff 9 October 2026. Financials FY2020–FY2025 and H1 2026. Euro valuation; US-listed return comparison. Porsche is an automotive stress peer, not a clean luxury-business equivalent: ownership, cyclicality, financing and capital intensity differ. Low earnings relative to EBITDA help explain Porsche’s higher P/E despite lower EV/EBITDA. Hermès and LVMH are relevant luxury comparators, but no unsourced multiples are inserted. The model is a comps/sensitivity exercise, not a DCF.
Risk-free assumption: 2.86% historical and 3.80% YTD stock-risk proxies; WACC is a separate estimated 7.32%.
Sources and common conventions →The portable notebook reviews the dated summary inputs offline. The linked original repository contains the full workflow.